Welcome to the quick start guide for the 5dchart Add-In for Microsoft Office Excel.
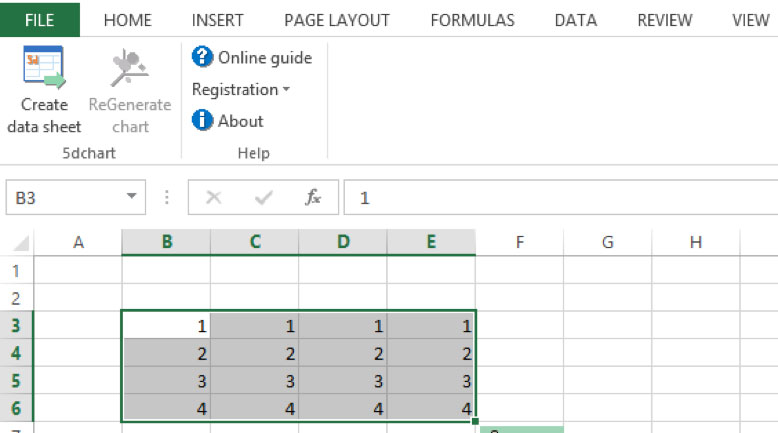
Select four continuous rows of data and press “Create data sheet”.
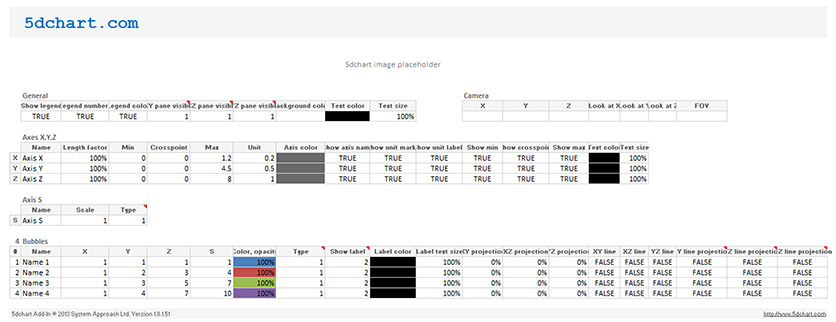
The data sheet is created automatically and contains all the settings for customizing the appearance of the chart. Please note that data on the datasheet is linked to the initial data, so you don’t need to change it twice. You can have multiple charts and corresponding data sheets for a single portion of the data. See the table below for a description of all the fields in the data sheet.
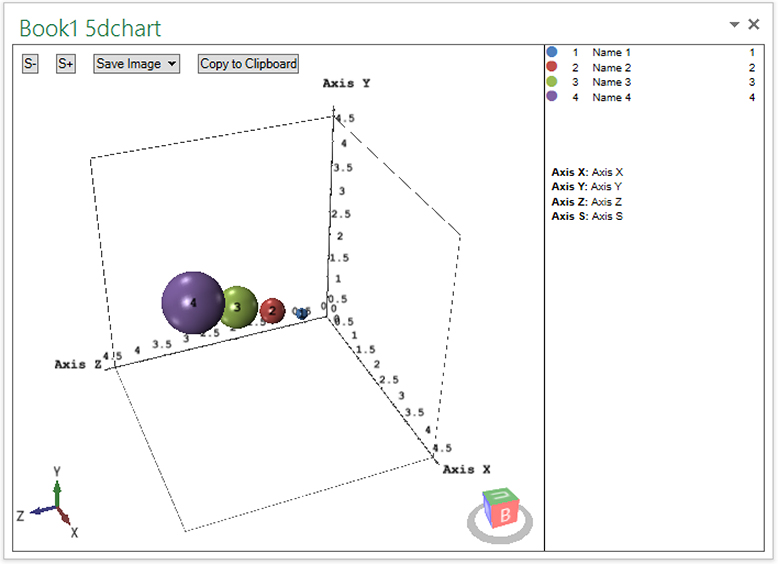
Create a chart by pressing “ReGenerate chart”.
You can control view, as follows:
Rotate – hold the right mouse button
Pan – hold Shift + the right mouse button
Change field of view – hold Alt + the right mouse button
Reset camera – press Home key or double click middle mouse button
Set new point of rotation – double-click the right mouse button
Switch between trackball and turntable rotation mode – Ctrl + T
Adjust the scale of the bubbles using the S- and S+ buttons.
Copy the chart image to the clipboard by clicking the “Copy to clipboard” button.
Saving the chart image in higher resolutions that are needed for printing is only possible in the purchased version of this add-in. Click “Save image” and choose needed DPI.
You can copy data from the legend and paste it into your presentation or any other document.
The camera position and small chart thumbnail are saved to the data sheet automatically.
Description of the data sheet fields
General |
|
| Show legend | Enable/disable legend display |
| Legend numbers | Show bubble numbers in the legend |
| Legend color | Show colour indicator for bubbles in the legend |
| XY pane visible XZ pane visible YZ pane visible |
Enable/disable axis panes visibility. 0 – disable axis pane 1 – show axis pane with border 2 – show axis pane with border and cross lines 3 – show axis pane with a grid |
| Background color | Define the background colour of the resulting chart. The evaluation copy will have additional evaluation watermarks |
| Text color | Text colour of chart legend |
| Text size | The text size for the legend text. Default – 100% |
Camera |
|
| FOV | Field of view |
| X, Y, Z Look at X, Look at Y, Look at Z Up direction X, Up direction Y, Up direction Z |
These cells store data on the last camera position. Clear all the values to reset to the default position |
Axes X,Y,Z |
|
| Name | Name of the axis |
| Length factor | Length factor of the axis. By adjusting this parameter you can make the axis longer or shorter |
| Min | Minimum value |
| Crosspoint | Point of crossing with other axis |
| Max | Maximum value |
| Unit | Step of the axis |
| Axis color | Colour of the axis line |
| Show axis name | Enable/disable axis name caption |
| Show unit marks | Enable/disable unit marks on the axis |
| Show unit labels | Enable/disable unit labels for one axis |
| Show min | Enable/disable visibility of the min value mark |
| Show crosspoint | Enable/disable visibility of the crosspoint |
| Show max | Enable/disable visibility of the max value mark |
| Text color | Defines the colour of all the captions for the axis |
| Text size | Size coefficient for the axis text captions |
Axis S |
|
| Name | Name of the size axis |
| Scale | Scale factor |
| Type | 1 – scaling as bubble radius (for cube – 1/2 length of side) 2 – scaling as bubble volume |
Regression plane |
|
| Show plane | Enable/disable regression plane display |
| Color | Colour of the regression plane |
| Width | Width coefficient |
| Length | Length coefficient |
| Cell size | The size of a cell |
| Minor/Major cells | Minor/Major grid line intervals |
| Resulting equation | A placeholder for the resulting equation |
Bubbles |
|
| Name | Bubble name |
| X, Y, Z | Bubble position |
| S | Bubble size (Radius or Volume, see Axis S type) |
| Color, opacity | Background – bubble colour, value – opacity. Default – 100% |
| Type | 0 – hidden from chart 1 – sphere 2 – cube |
| Show label | 0 – no label 1 – bubble name 2 – bubble number 3 – bubble size |
| Label color | Bubble label colour |
| Label text size | Bubble label text size factor |
| XY XZ YZ projection | Coefficient for enable/disable Projection of the bubble to the axis panes |
| XY XZ YZ line | Draw line from the bubble to the corresponding axis panes |
| XY XZ YZ line projection | Draw line projections of the axis panes (only if the XY XZ YZ lines are enabled) |


